 Catalogue PIGMA
100 km
Type of resources
Available actions
Topics
Keywords
Contact for the resource
Provided by
Years
Formats
Representation types
Update frequencies
Resolution
-
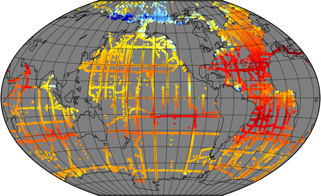
In recent years, large datasets of in situ marine carbonate system parameters (partial pressure of CO2 (pCO2), total alkalinity, dissolved inorganic carbon and pH) have been collated. These carbonate system datasets have highly variable data density in both space and time, especially in the case of pCO2, which is routinely measured at high frequency using underway measuring systems. This variation in data density can create biases when the data are used, for example for algorithm assessment, favouring datasets or regions with high data density. A common way to overcome data density issues is to bin the data into cells of equal latitude and longitude extent. This leads to bins with spatial areas that are latitude and projection dependent (eg become smaller and more elongated as the poles are approached). Additionally, as bin boundaries are defined without reference to the spatial distribution of the data or to geographical features, data clusters may be divided sub-optimally (eg a bin covering a region with a strong gradient). To overcome these problems and to provide a tool for matching in situ data with satellite, model and climatological data, which often have very different spatiotemporal scales both from the in situ data and from each other, a methodology has been created to group in situ data into ‘regions of interest’, spatiotemporal cylinders consisting of circles on the Earth’s surface extending over a period of time. These regions of interest are optimally adjusted to contain as many in situ measurements as possible. All in situ measurements of the same parameter contained in a region of interest are collated, including estimated uncertainties and regional summary statistics. The same grouping is done for each of the other datasets, producing a dataset of matchups. About 35 million in situ datapoints were then matched with data from five satellite sources and five model and re-analysis datasets to produce a global matchup dataset of carbonate system data, consisting of 287,000 regions of interest spanning 54 years from 1957 to 2020. Each region of interest is 100 km in diameter and 10 days in duration. An example application, the reparameterisation of a global total alkalinity algorithm, is shown. This matchup dataset can be updated as and when in situ and other datasets are updated, and similar datasets at finer spatiotemporal scale can be constructed, for example to enable regional studies. This dataset was funded by ESA Satellite Oceanographic Datasets for Acidification (OceanSODA) project which aims at developing the use of satellite Earth Observation for studying and monitoring marine carbonate chemistry.
-
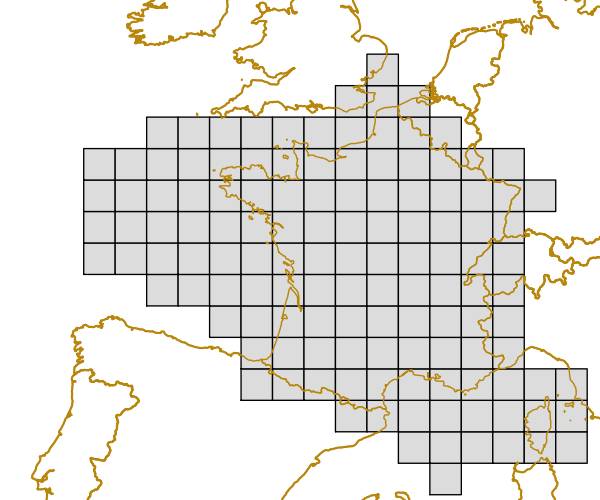
The grid is based on proposal at the 1st European Workshop on Reference Grids in 2003 and later INSPIRE geographical grid systems. The sample grid available here is part of a set of three polygon grids in 1, 10 and 100 kilometres. The grids cover at least country borders and, where applicable, marine Exclusive Economic Zones v7.0, http://www.marineregions.org. Note that the extent of the grid into the marine area does not reflect the extent of the territorial waters.
-
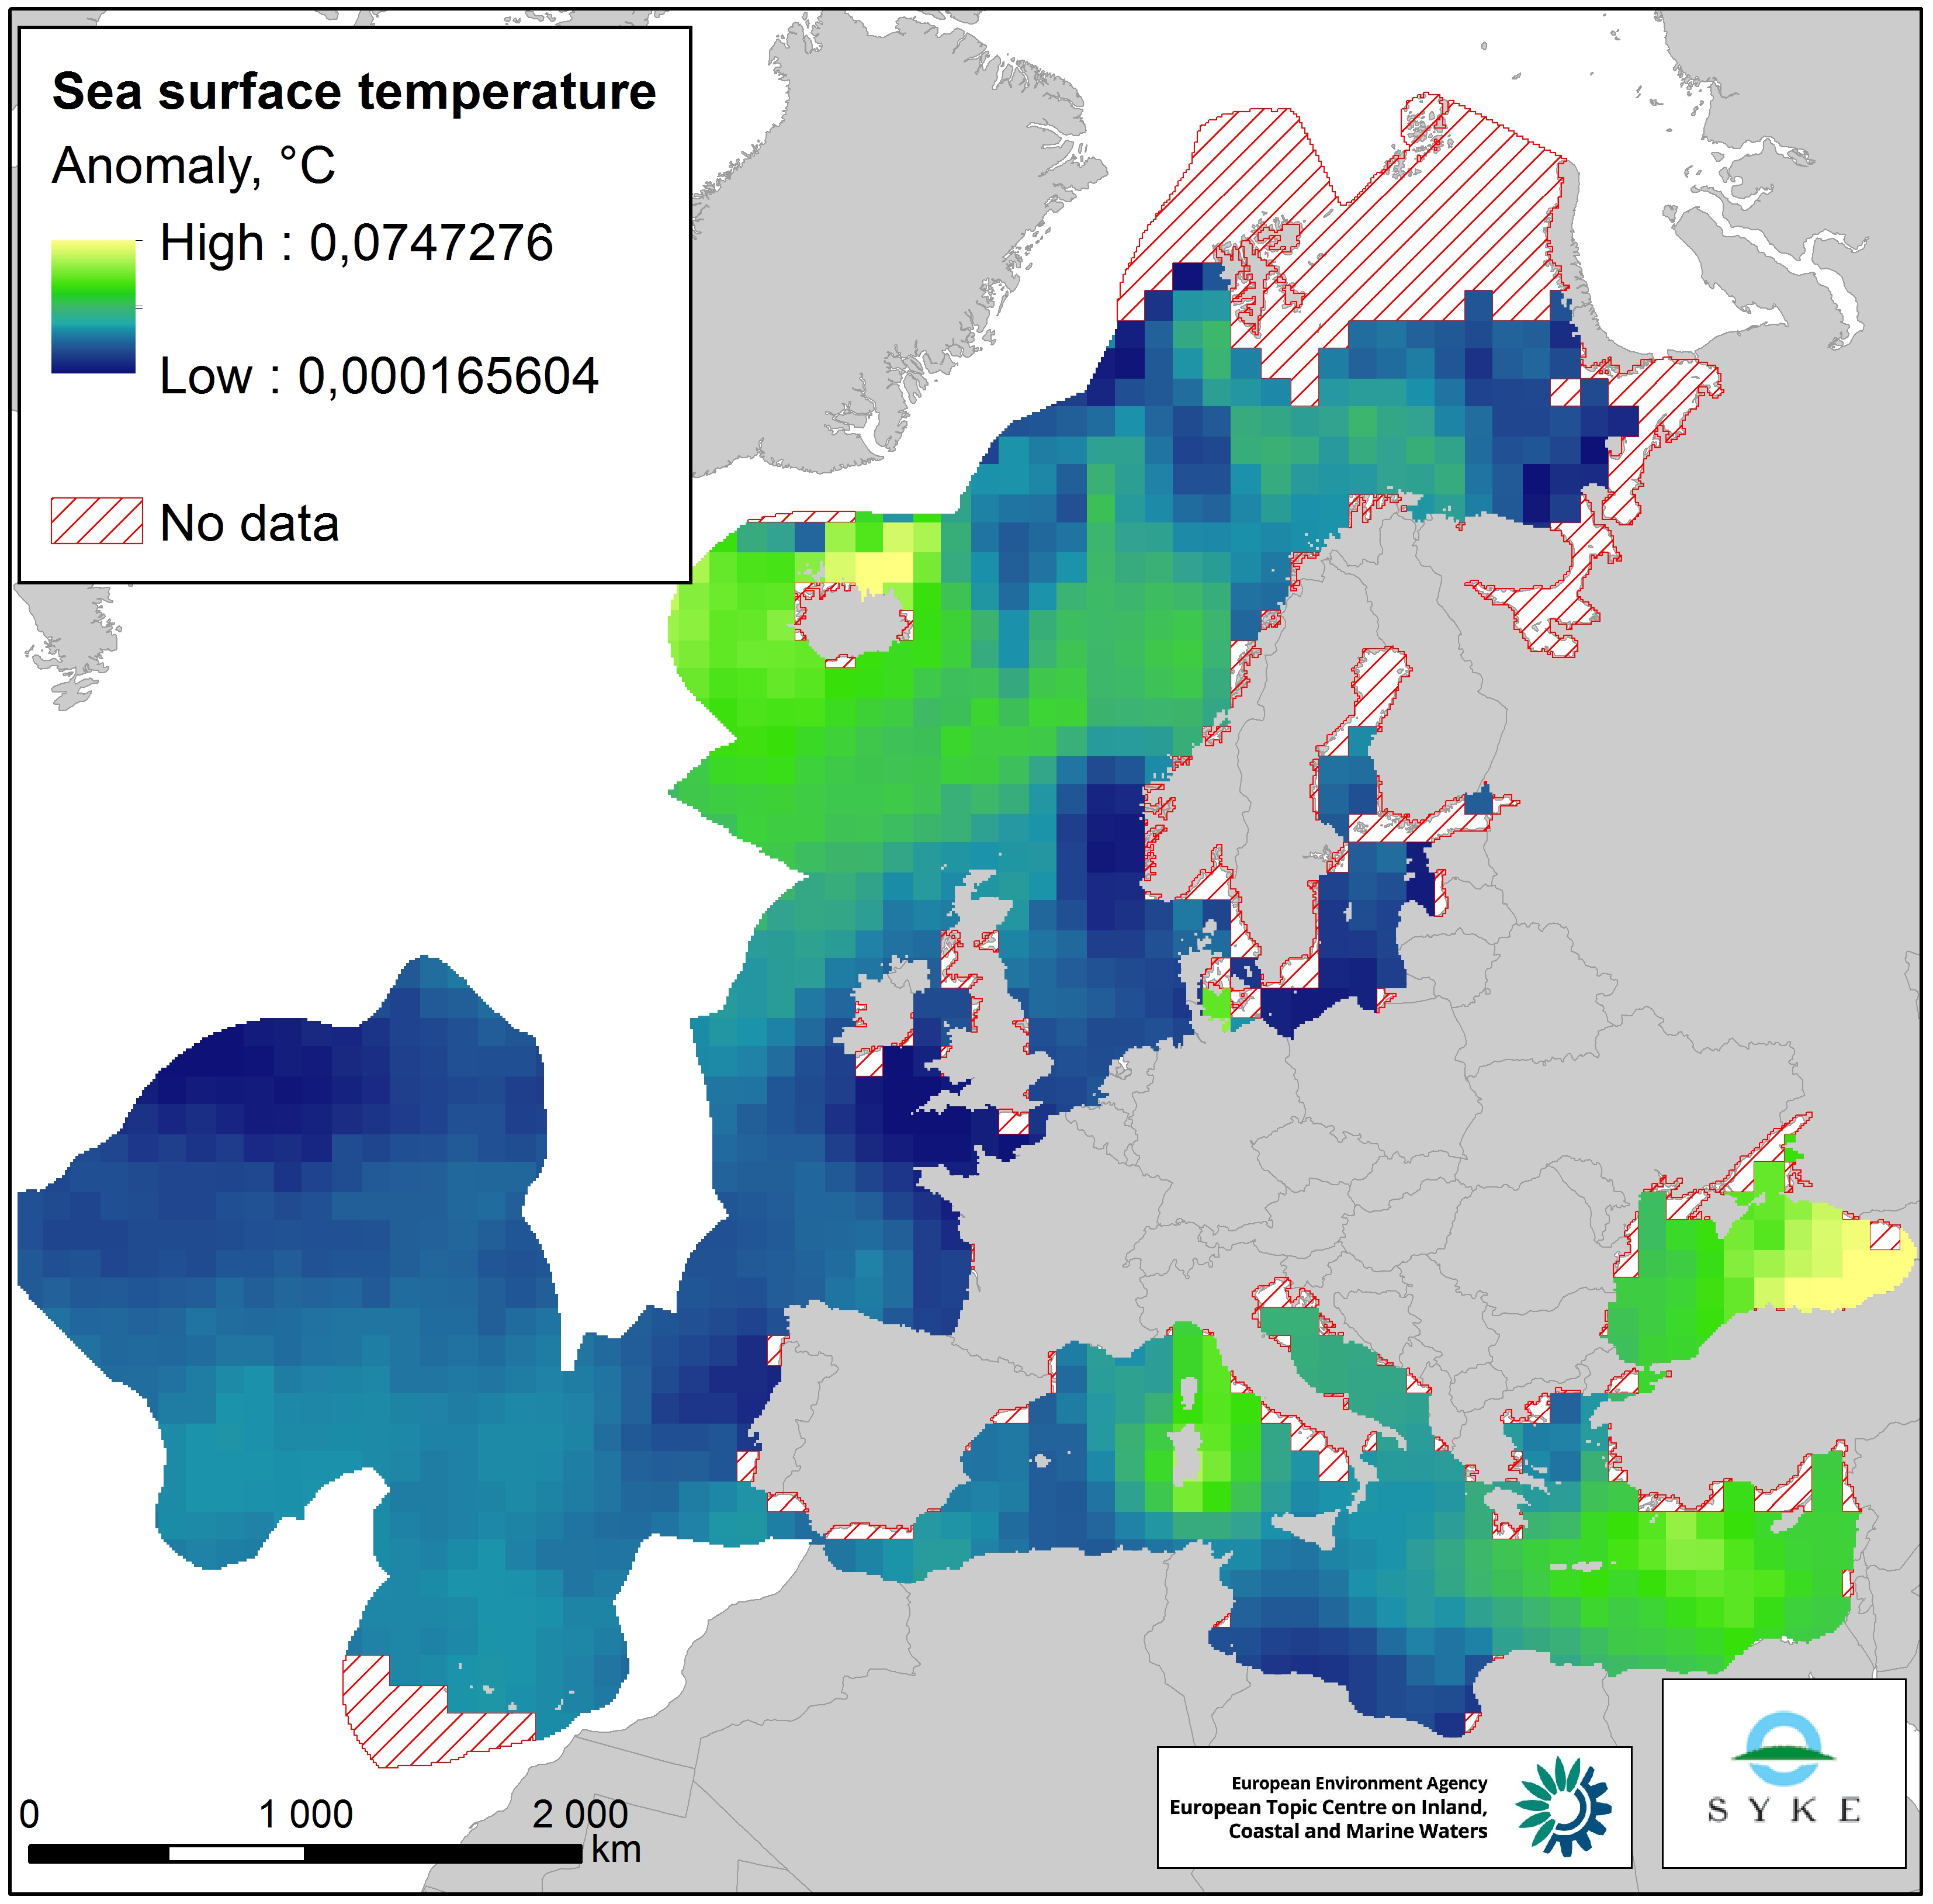
This raster dataset represents the Sea Surface Temperature (SST) anomalies, i.e. changes of sea temperatures, in the European Seas. The dataset is based on the map "Mean annual sea surface temperature trend in European seas" by Istituto Nazionale di Geofisica e Vulcanologia (INGV), which depicts the linear trend in sea surface temperature (in °C/yr) for the European seas over the past 25 years (1989-2013). Since all changes of sea temperatures can be considered to have an impact on the marine environment, the pressure layer includes absolute values of SST anomalies, i.e. negative/decreasing temperature trends were changed to positive values so that they represent a pressure. The original data was in a 1° grid format but was converted to a 100 km resolution, adapted to the EEA 10 km grid and clipped with the area of interest. This dataset has been prepared for the calculation of the combined effect index, produced for the ETC/ICM Report 4/2019 "Multiple pressures and their combined effects in Europe's seas" available on: https://www.eionet.europa.eu/etcs/etc-icm/etc-icm-report-4-2019-multiple-pressures-and-their-combined-effects-in-europes-seas-1.
-
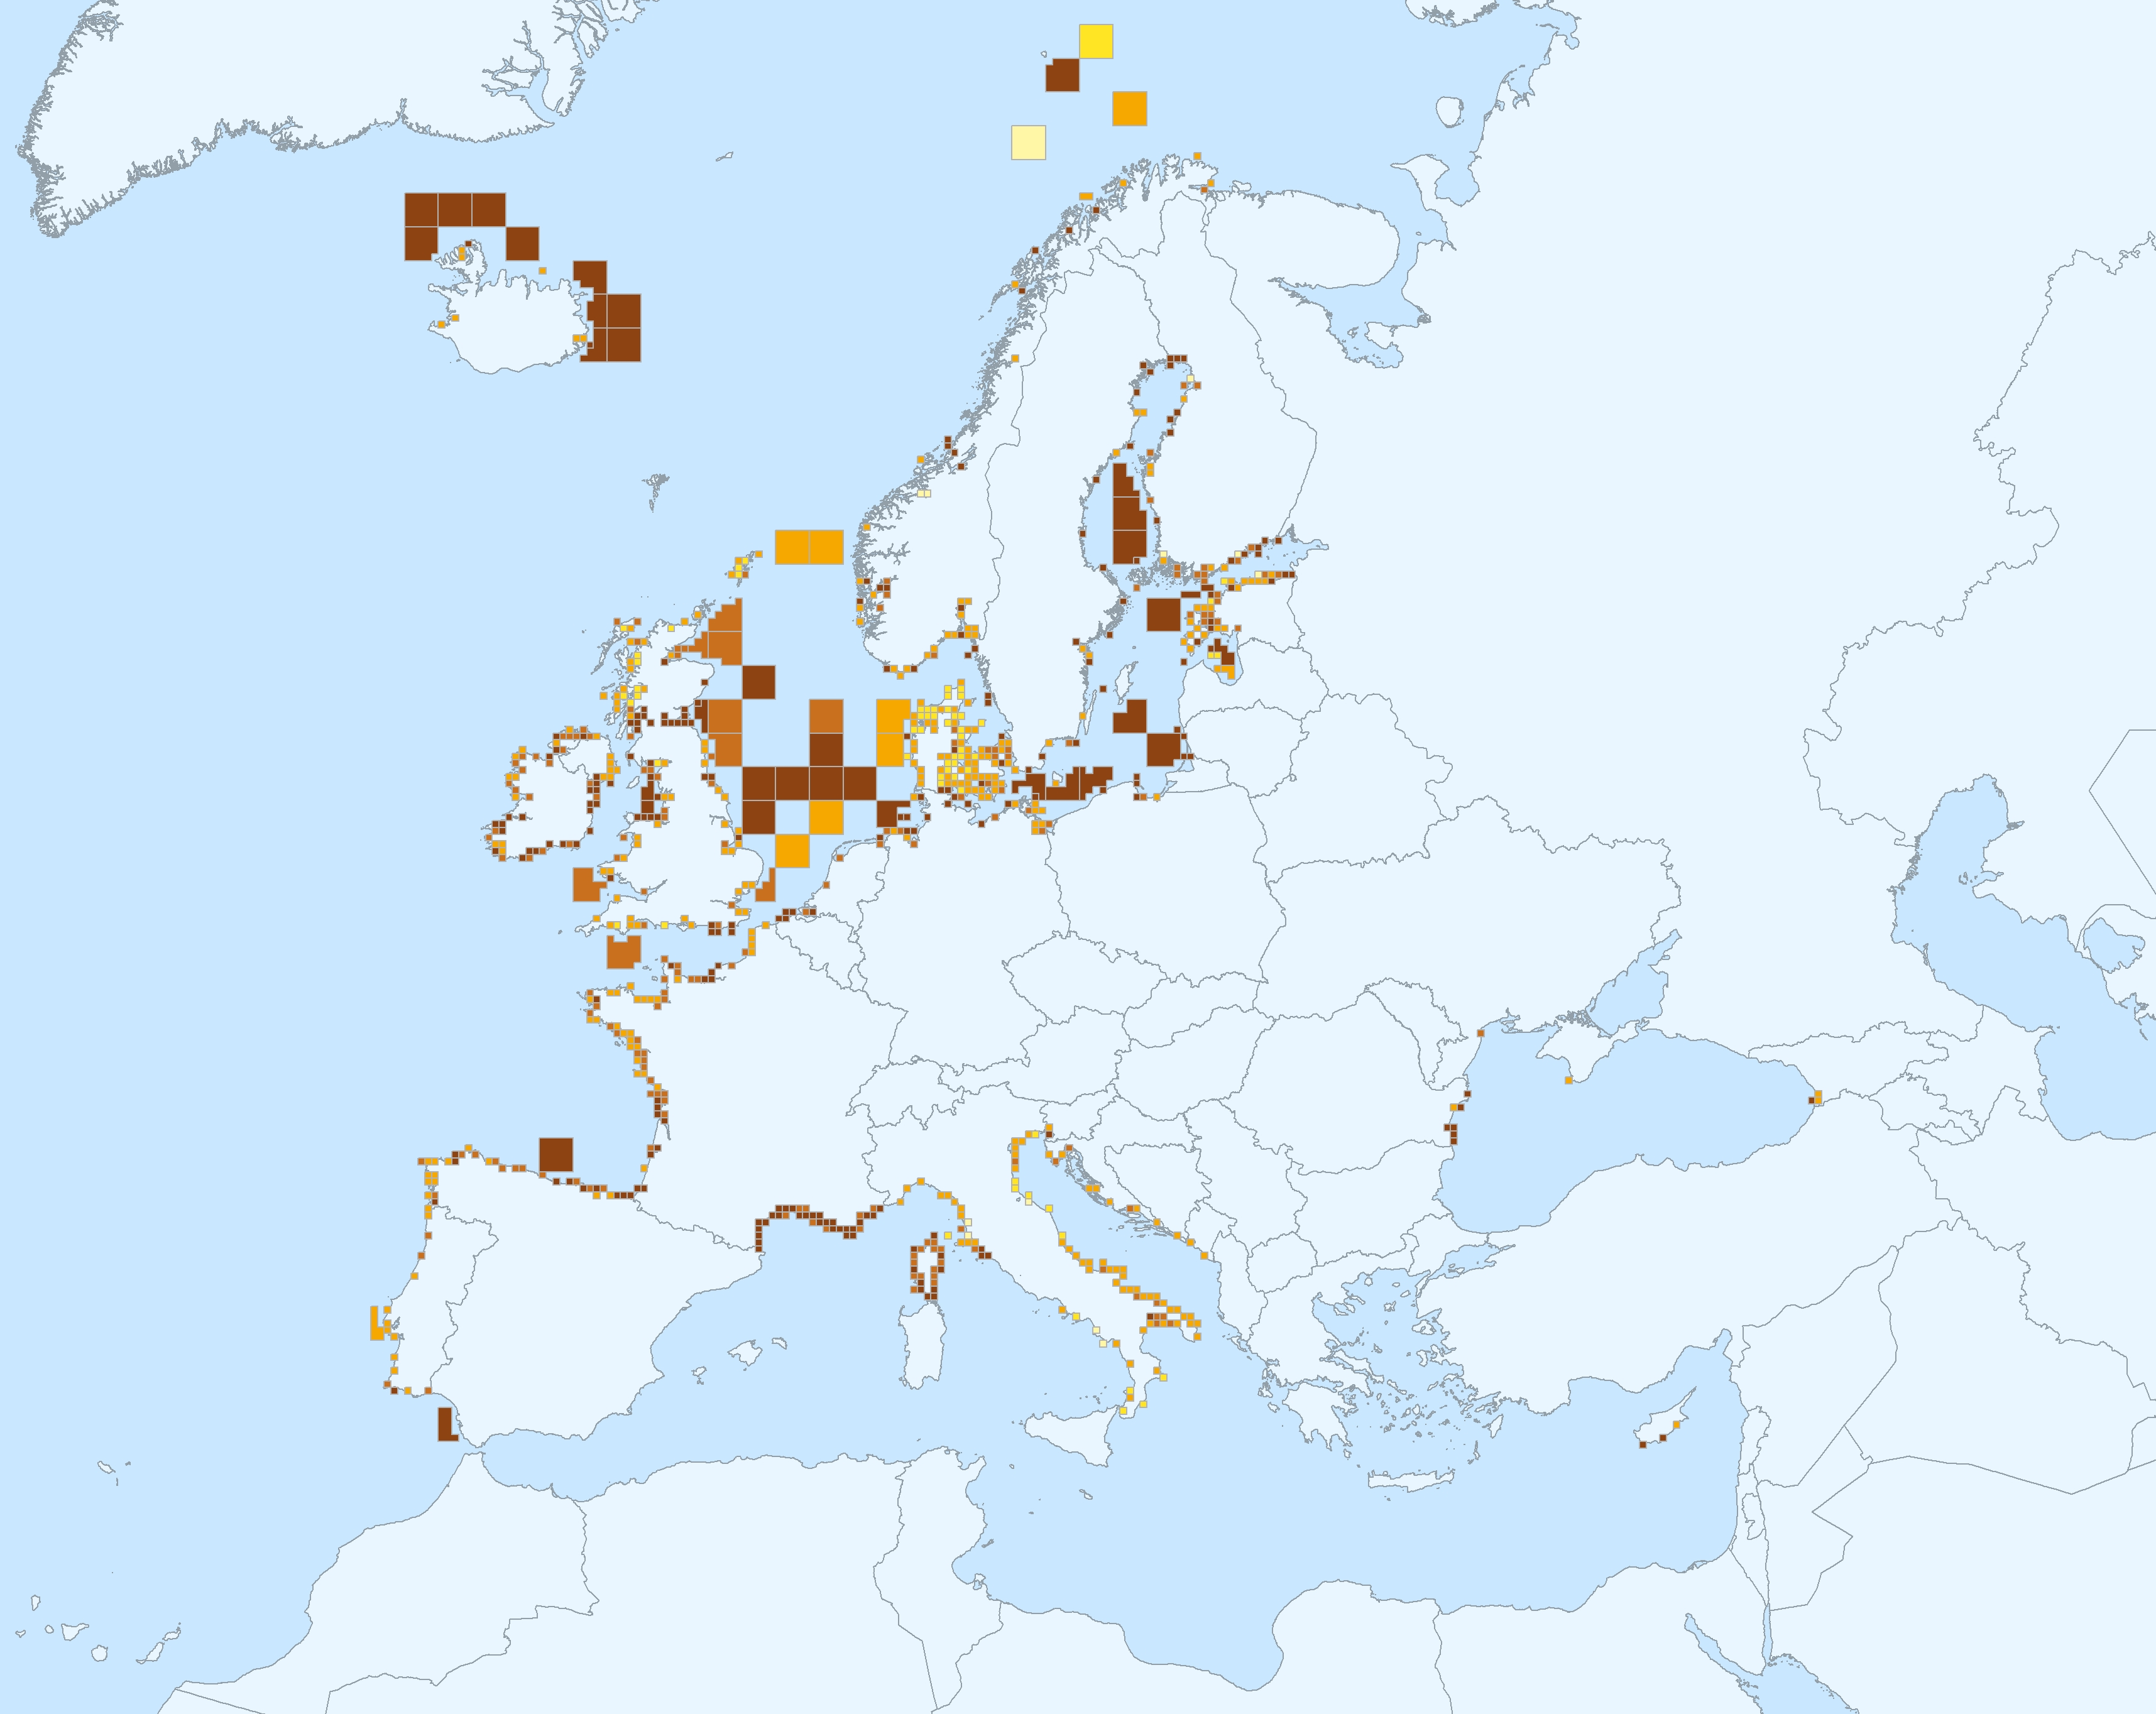
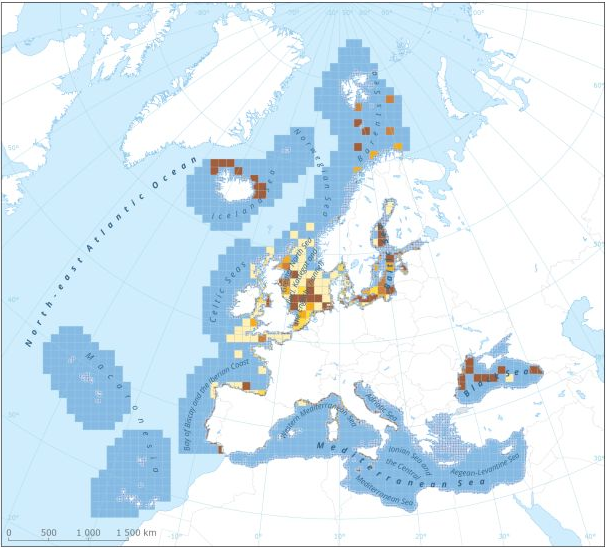
This data set presents the resulting assessment grid (based on the EEA reference grid) with the classification of chemical status of the transitional, coastal and marine waters in the context of the Water Framework Directive (WFD) and the Marine Strategy Framework Directive (MSFD), with a mapping of contamination 'problem areas' and ‘non-problem areas’ based on measurements in the matrix 'biota'. This classification has been performed using the CHASE+ tool, with classifications of the biota matrix. The chemical status is evaluated in five classes, where NPAhigh and NPAgood are recognised as ‘non-problem areas’ and PAmoderate, PApoor and PAbad are recognised as ‘problem areas’. Monitoring and assessment for the matrix 'biota' has been carried out in the North-East Atlantic Ocean (482 assessment units), Baltic sea (198 assessment units), Mediterranean Sea (161 assessment units) and Black sea (12 assessment units). This data set underpins the findings and cartographic representations published in the EEA report “Contaminants in Europe’s seas” (No 25/2018): https://www.eea.europa.eu/publications/contaminants-in-europes-seas. See the mentioned report for further information as well as examples of classification excluding specific groups of substances (e.g. metals, PBDEs).
-
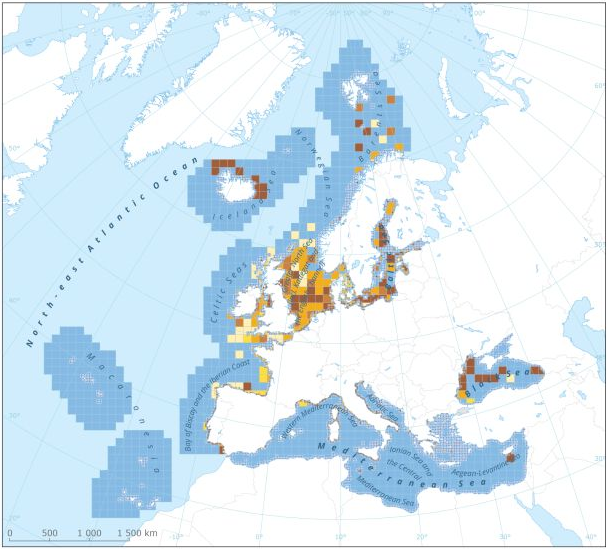
This dataset presents the resulting assessment grid (based on the EEA reference grid) with the classification of chemical status of the transitional, coastal and marine waters in the context of the Water Framework Directive (WFD) and the Marine Strategy Framework Directive (MSFD). This classification has been performed using the CHASE+ tool, with classifications of the matrices ‘water’, ‘sediment’ and ‘biota’ and indicators of ‘biological effects’, as well as an integrated classification of chemical status, combining results of all matrices. The chemical status is evaluated in five classes, where NPAhigh and NPAgood are recognised as ‘non-problem areas’ and PAmoderate, PApoor and PAbad are recognised as ‘problem areas’. This is the assessment made excluding concentrations of metals. The overall area of interest used is based on the marine regions and subregions under the Marine Strategy Framework Directive. Additionally, Norwegian (Barent Sea and Norwegian Sea) and Icelandic waters (’Iceland Sea’) have been added (see Surrounding seas of Europe). Note that within the North East Atlantic region only the subregions within EEZ boundaries (~200 nm) have been included. This dataset underpins the findings and cartographic representations published in the report "Contaminants in Europe's Seas" (EEA, 2019).
-
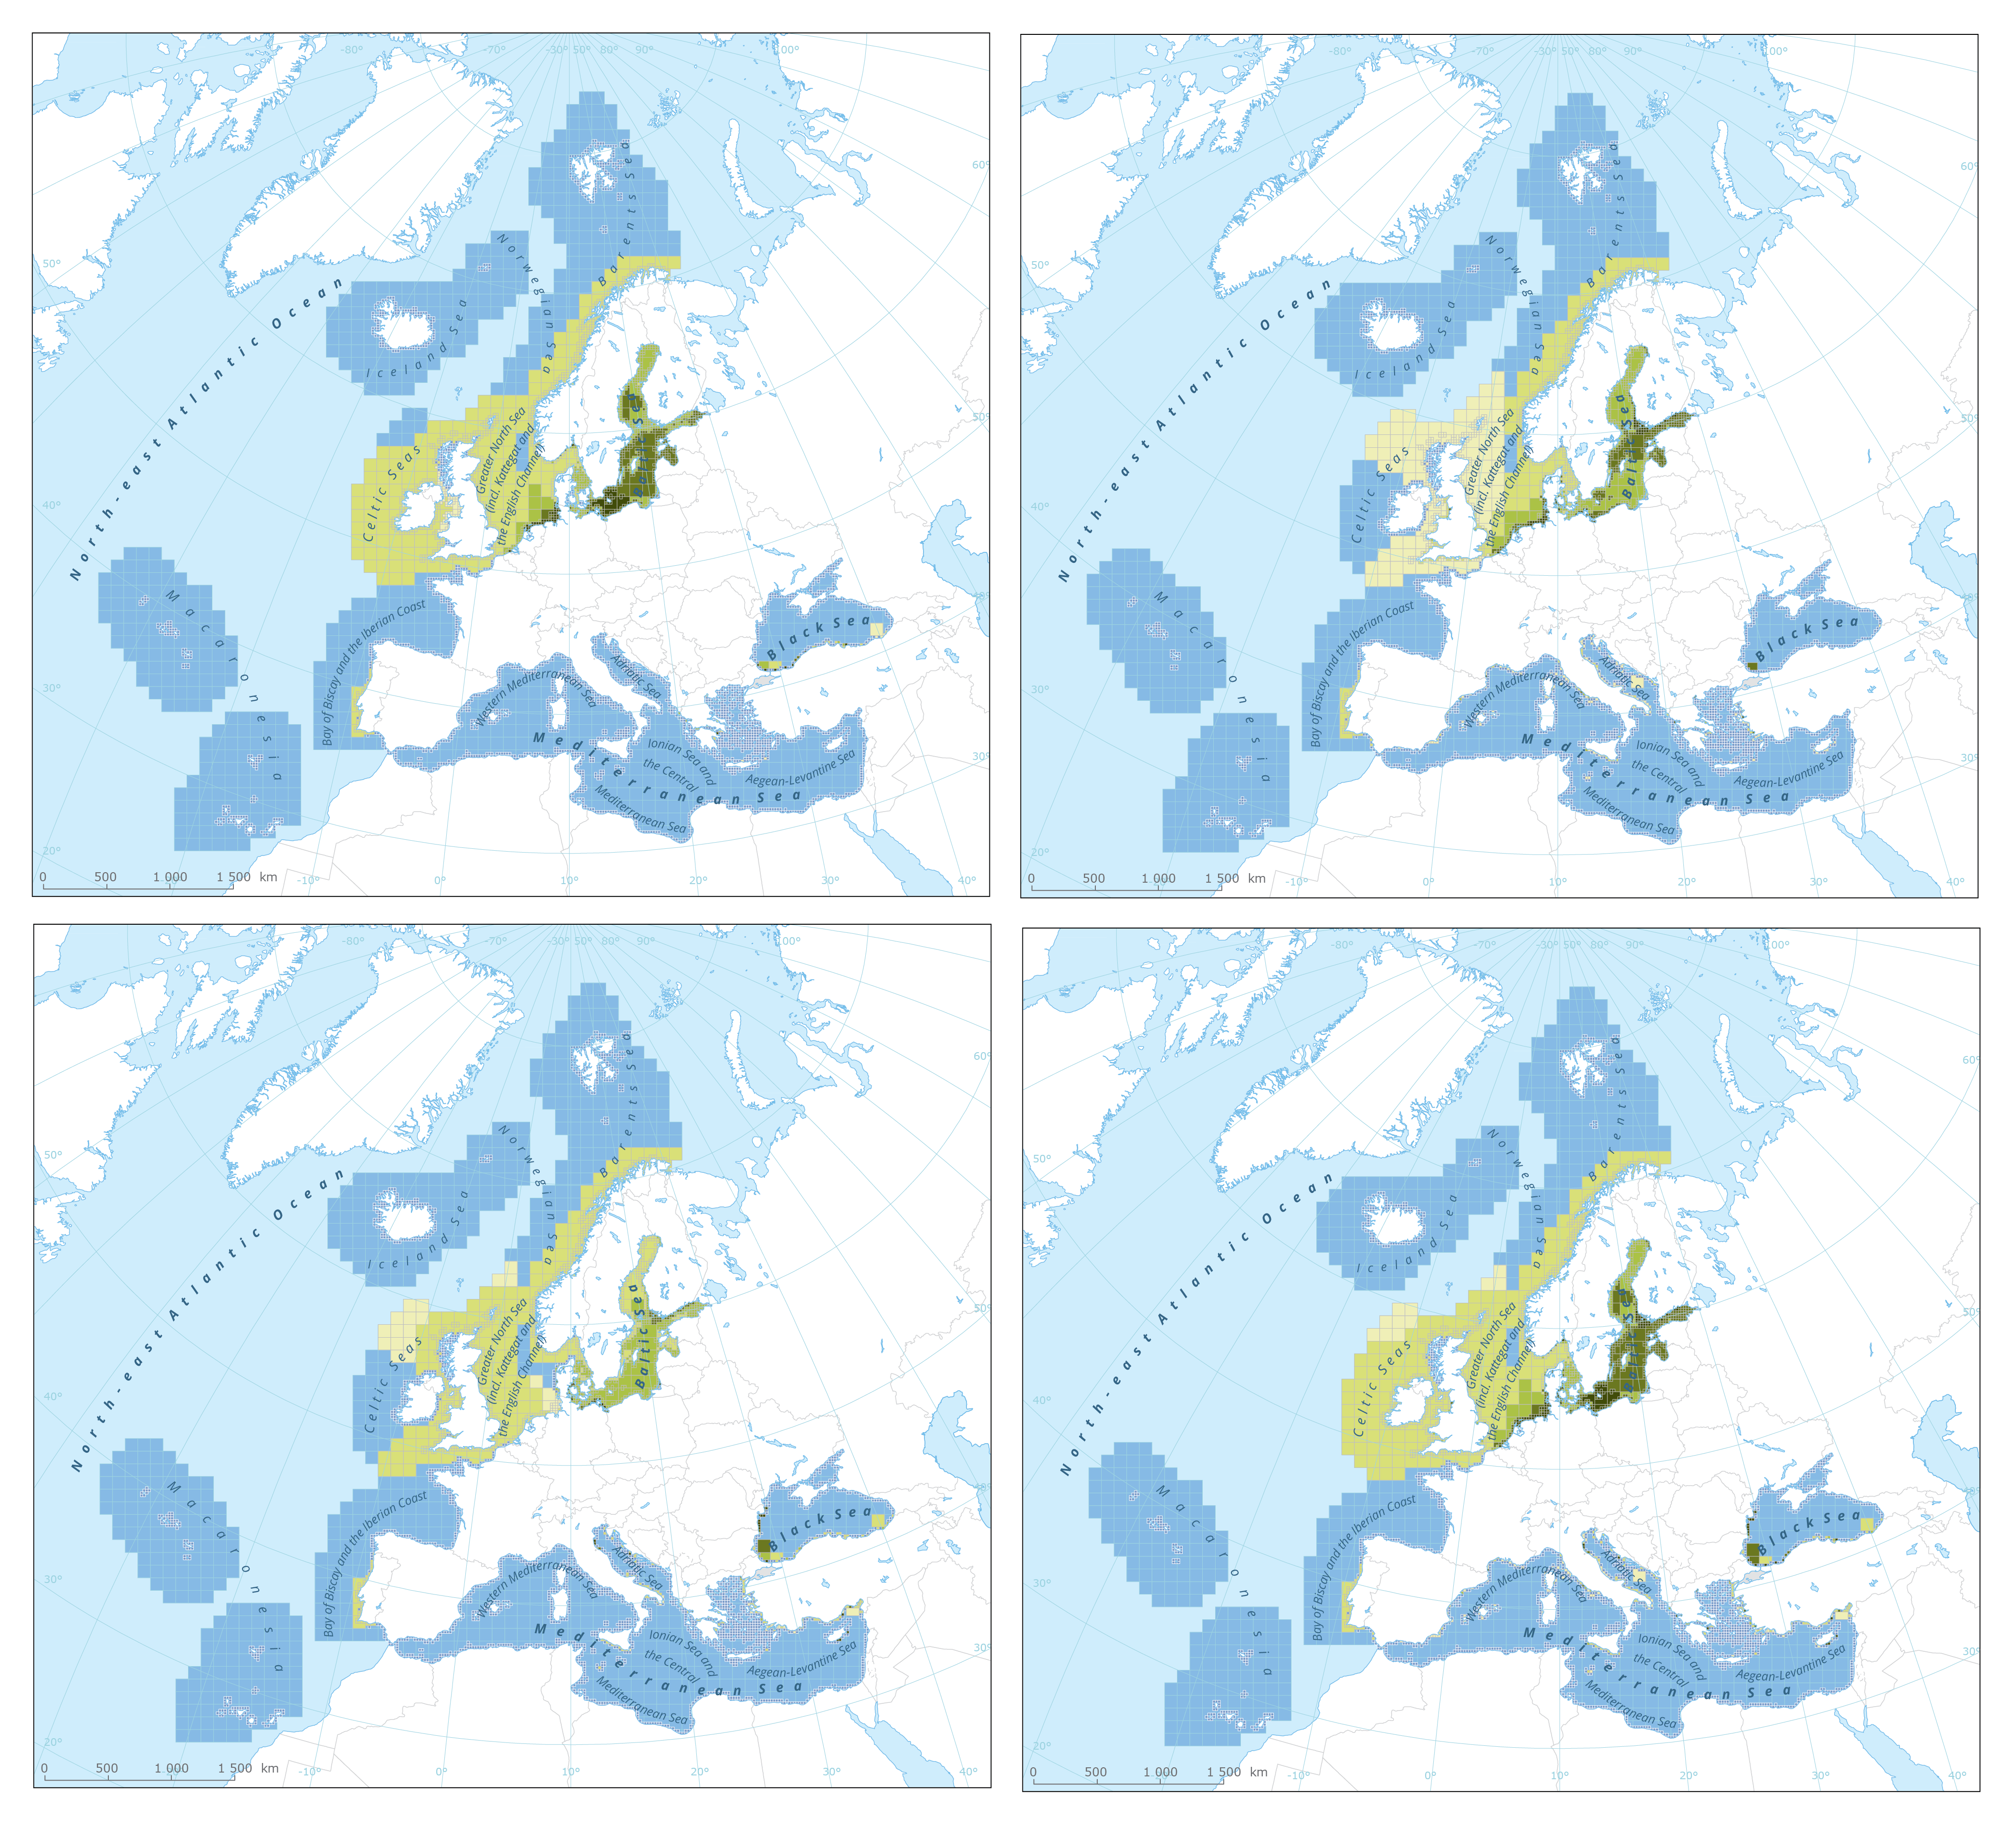
The dataset presents the results of classification of eutrophication status of the European seas using the HEAT+ tool. Eutrophication status is evaluated in five classes, where NPAhigh and NPAgood are recognised as ‘non-problem areas’ and PAmoderate, PApoor and PAbad are recognised as ‘problem areas’. Besides the overall Eutrophication status (HEAT+) are the results shown for three aspects of eutrophication: C1) Nutrient Concentrations C2) Direct Effects C3) Indirect Effects This dataset underpins the findings and cartographic representations published in the report "Nutrient enrichment and eutrophication in Europe's seas" (EEA, 2019): https://www.eea.europa.eu/publications/nutrient-enrichment-and-eutrophication-in.
-
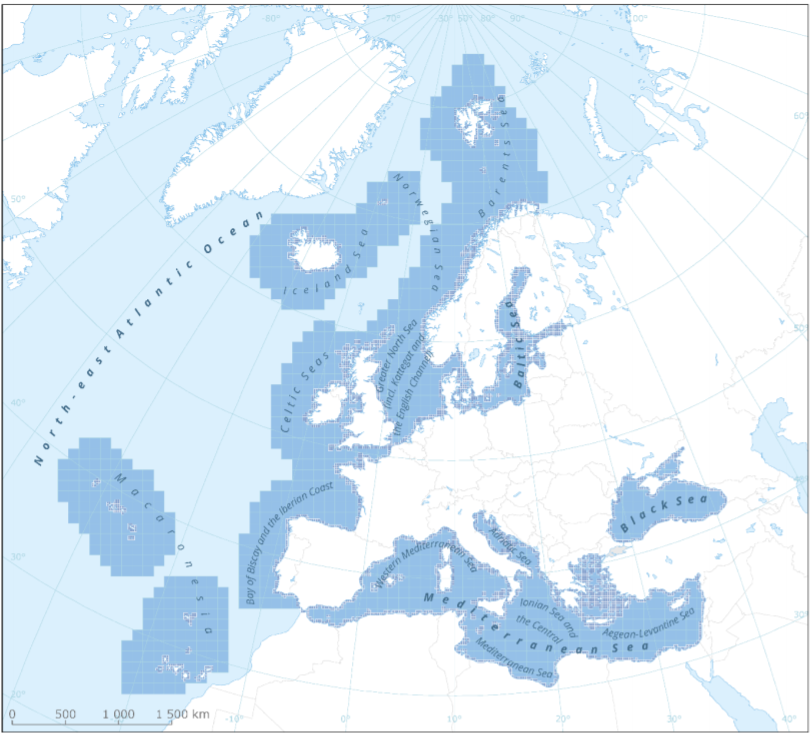
This metadata refers to the EEA marine assessment grid, to which all data and assessment results have been spatially mapped in order to ensure that data can be compared in a uniform way across the European regional seas. The marine assessment grid is based on the EEA reference grid system. The EEA reference grid is based on ERTS89 Lambert Azimuthal Equal Area projection with parameters: latitude of origin 52° N, longitude of origin 10° E, false northing 3 210 000.0 m, false easting 4 321 000.0 m. All grid cells are named with a unique identifier containing information on grid cell size and the distance from origin in meters (easting and northing). An important attribute of the EEA reference grid system is that by using an equal area projection all grid cells are having the same area for the same grid size. In this marine assessment grid, two grid sizes are used: * 100 x 100 km in offshore areas (> 20 km from the coastline) * 20 x 20 km in coastal areas (<= 20 km from the coastline) The grid sizes were choosen after an evaluation of data availability versus the need for sufficient detail in the resulting assessment. The resulting assessment grid is a combination of two grid sizes using the EEA reference grid system. The overall area of interest used in the grid is based on the marine regions and subregions under the Marine Strategy Framework Directive (MSFD). Additionally, Norwegian (Barent Sea and Norwegian Sea) and Icelandic waters (’Iceland Sea’) have been added (see Surrounding seas of Europe). Note that, within the North East Atlantic region, only the subregions within EEZ boundaries (~200 nm) have been included.
-
This dataset presents the resulting assessment grid (based on the EEA reference grid) with the classification of chemical status of the transitional, coastal and marine waters in the context of the Water Framework Directive (WFD) and the Marine Strategy Framework Directive (MSFD). This classification has been performed using the CHASE+ tool, with classifications of the matrices ‘water’, ‘sediment’ and ‘biota’ and indicators of ‘biological effects’, as well as an integrated classification of chemical status, combining results of all matrices. The chemical status is evaluated in five classes, where NPAhigh and NPAgood are recognised as ‘non-problem areas’ and PAmoderate, PApoor and PAbad are recognised as ‘problem areas’. This is the assessment made excluding concentrations of mercury (Hg). The overall area of interest used is based on the marine regions and subregions under the Marine Strategy Framework Directive. Additionally, Norwegian (Barent Sea and Norwegian Sea) and Icelandic waters (’Iceland Sea’) have been added (see Surrounding seas of Europe). Note that within the North East Atlantic region only the subregions within EEZ boundaries (~200 nm) have been included. This dataset underpins the findings and cartographic representations published in the report "Contaminants in Europe's Seas" (EEA, 2019).
-
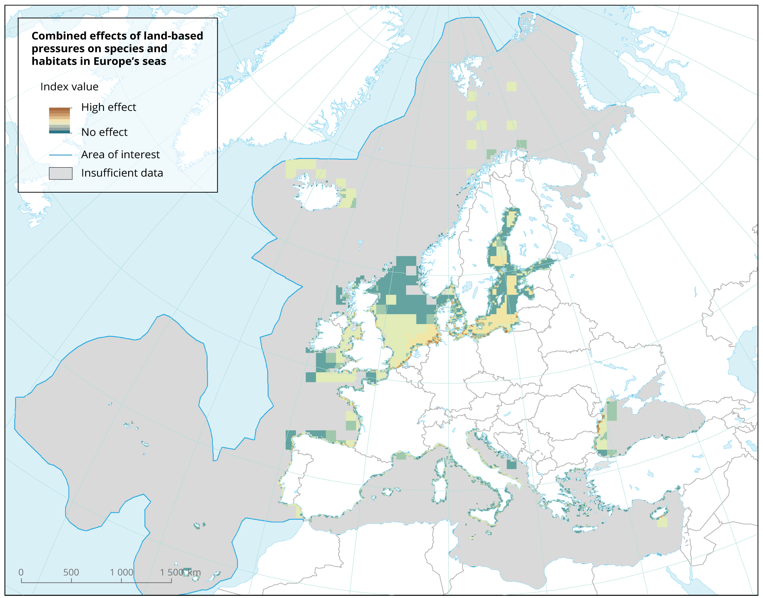
The dataset presents the potential combined effects of land-based pressures on marine species and habitats estimated using the method for assessment of cumulative effects, for the entire suite of pressures and a selected set of marine species groups and habitats by an index (Halpern et al. 2008). The spatial assessment of combined effects of multiple pressures informs of the risks of human activities on the marine ecosystem health. The methodology builds on the spatial layers of pressures and ecosystem components and on an estimate of ecosystem sensitivity through an expert questionnaire. The raster dataset consists of a division of the Europe's seas in 10km and 100 km grid cells, which values represents the combined effects index values for pressures caused by land-based human activities. The relative values indicate areas where the pressures potentially affect the marine ecosystem. This dataset underpins the findings and cartographic representations published in the report "Marine Messages" (EEA, 2020).
-
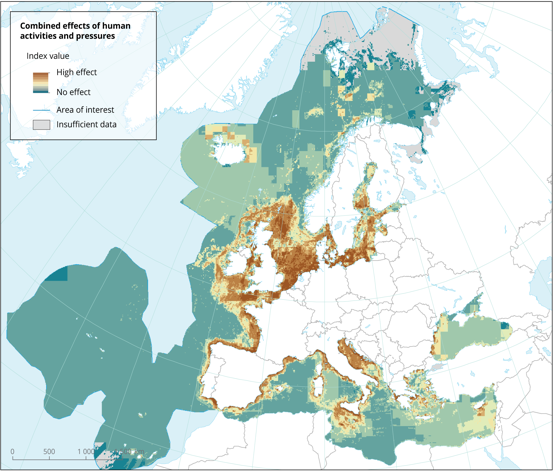
The dataset presents the potential combined effects of human activities and pressures on marine species and habitats estimated using the method for assessment of cumulative effects, for the entire suite of pressures and a selected set of marine species groups and habitats by an index (Halpern et al. 2008). The spatial assessment of combined effects of multiple pressures informs of the risks of human activities on the marine ecosystem health. The methodology builds on the spatial layers of pressures and ecosystem components and on an estimate of ecosystem sensitivity through an expert questionnaire. The raster dataset consists of a division of the Europe's seas in 10km and 100 km grid cells, which values represents the combined effects index values for pressures caused by human activities. The relative values indicate areas where the pressures potentially affect the marine ecosystem. This dataset underpins the findings and cartographic representations published in the report "Marine Messages" (EEA, 2020).